Work
Trading Bot Visualizer
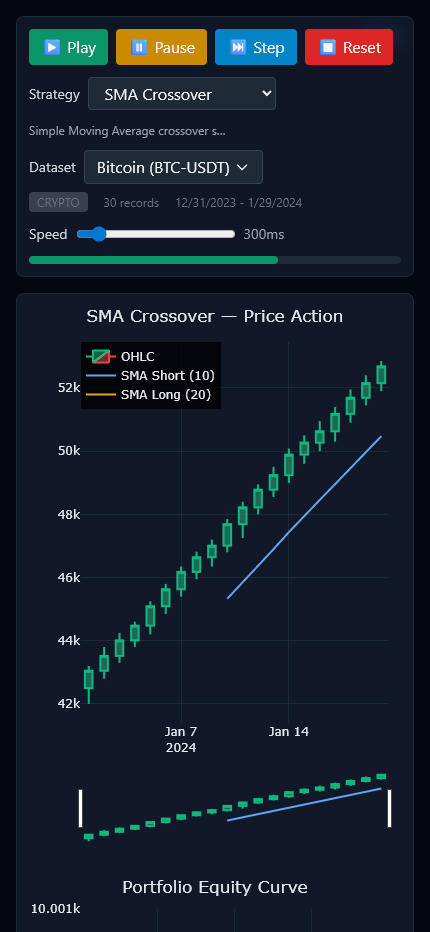
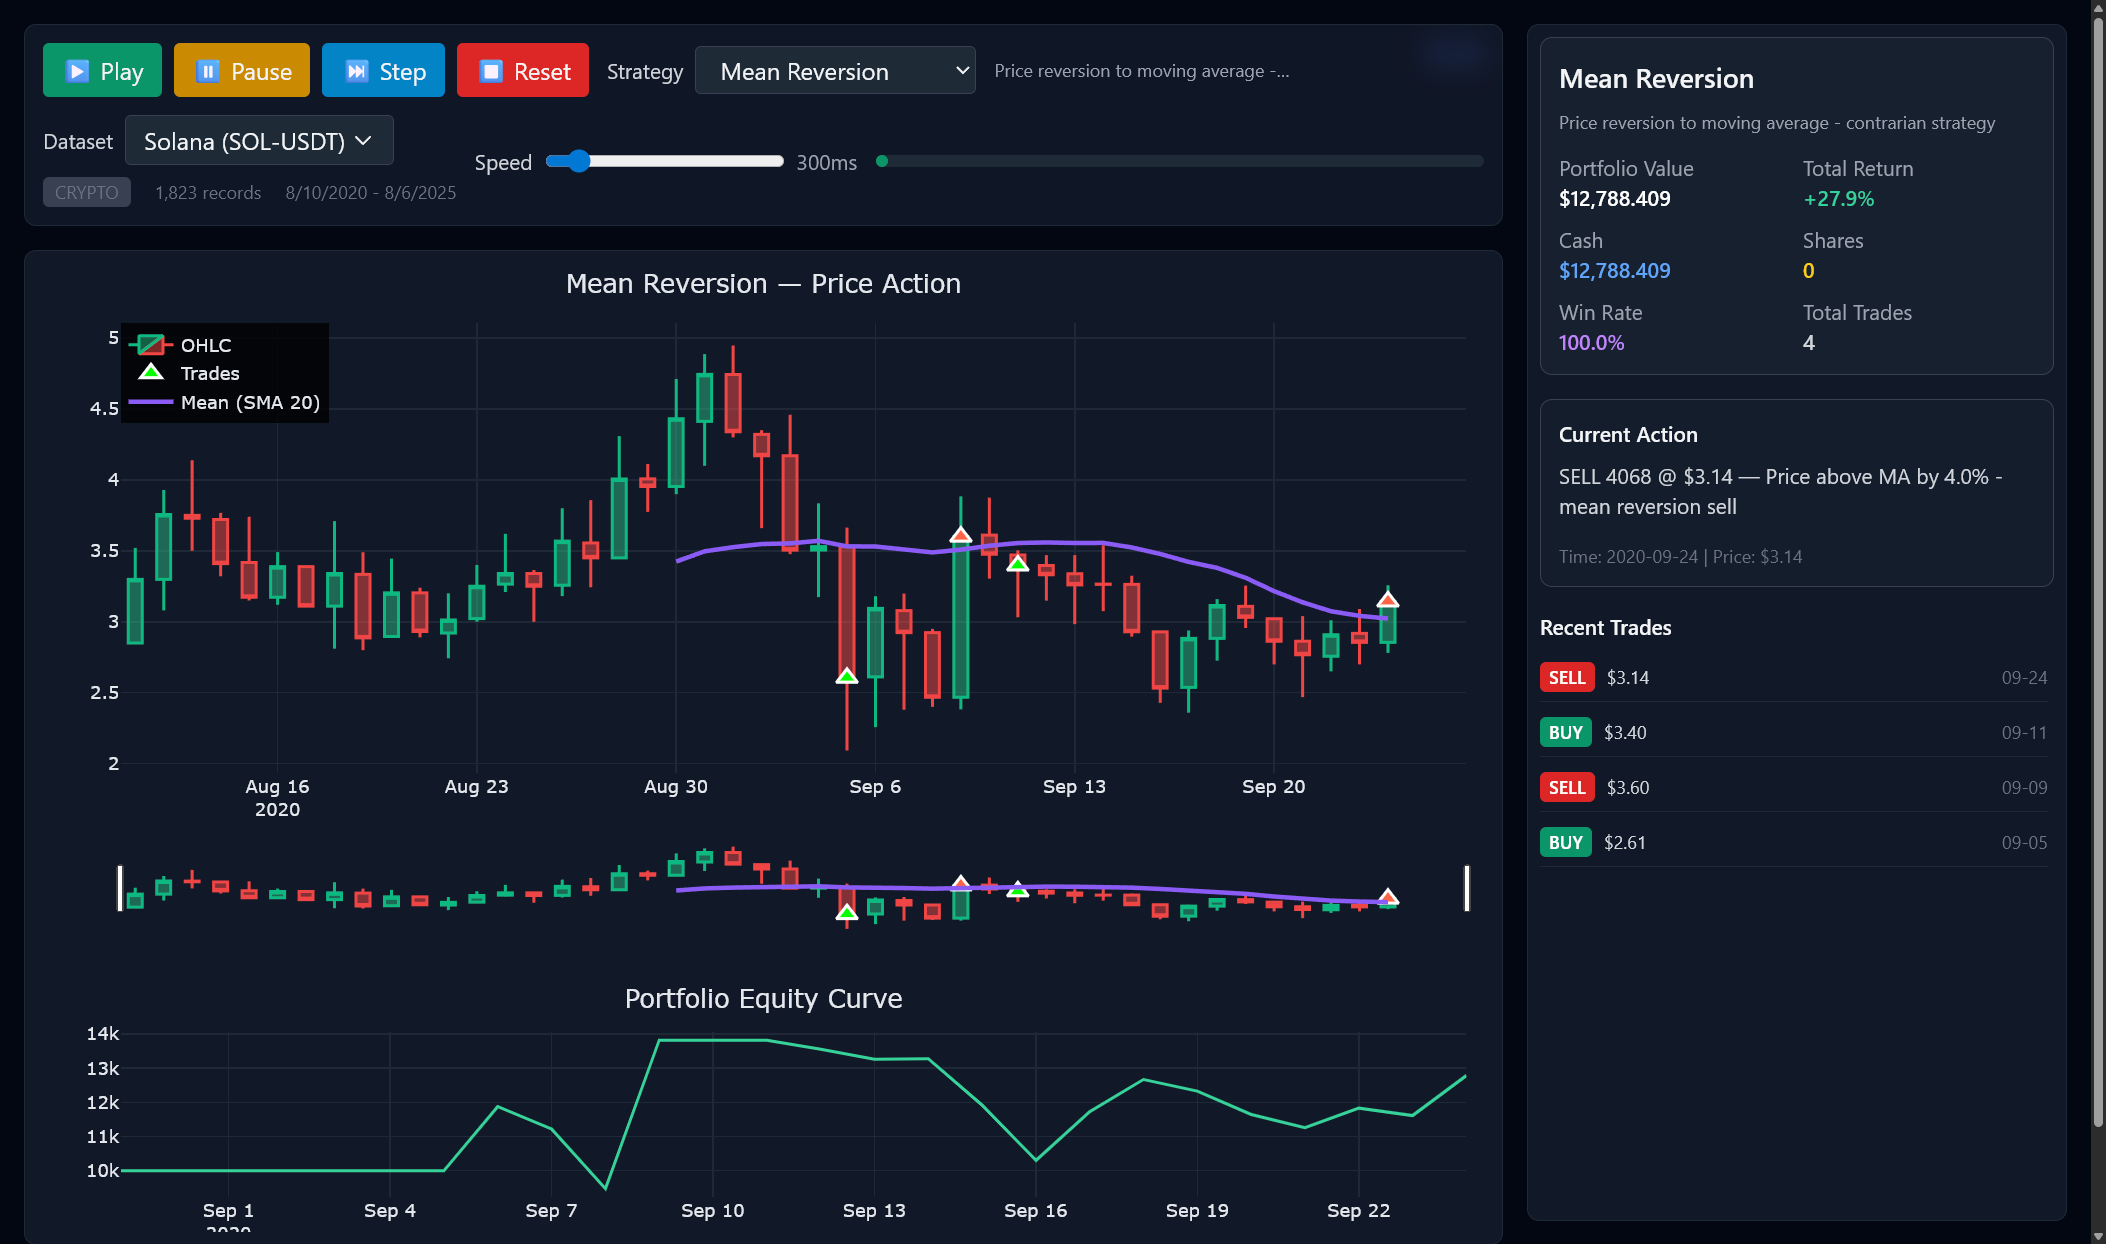
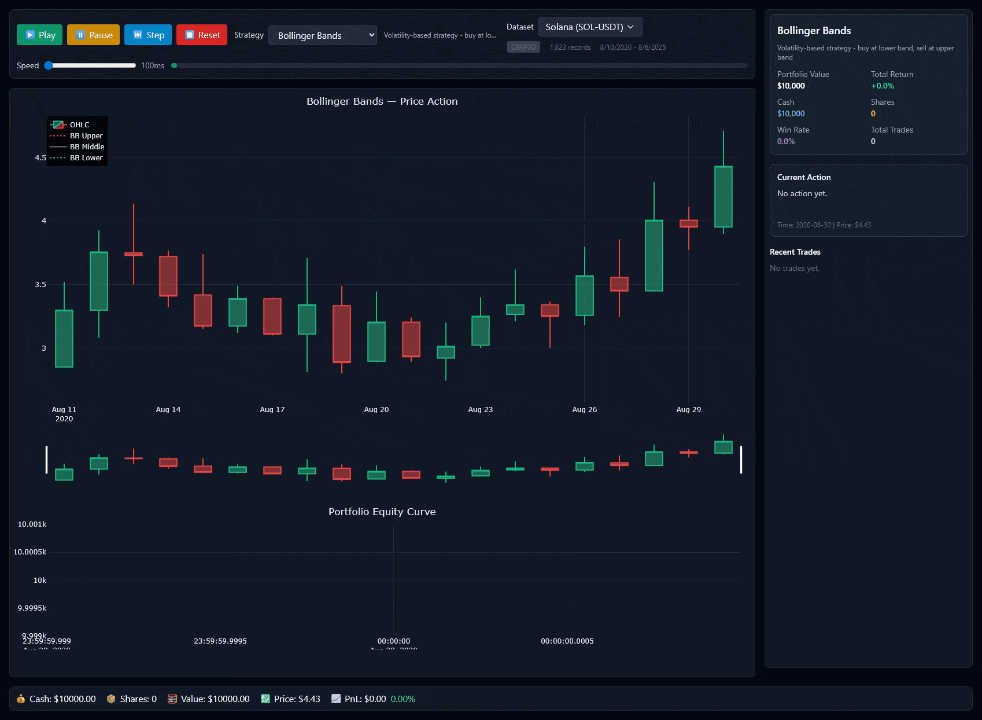
Trading Bot Visualizer is a comprehensive platform for testing and visualizing various trading strategies using real historical market data. The tool allows traders and developers to backtest algorithms, analyze performance metrics, and visualize strategy effectiveness through interactive charts and detailed analytics.
| Year | 2025 |
| Tech Stack | Next.js, React, TypeScript, Chart.js, TailwindCSS, Yahoo Finance API |
| Website | trading-bot-visualizer.vercel.app |
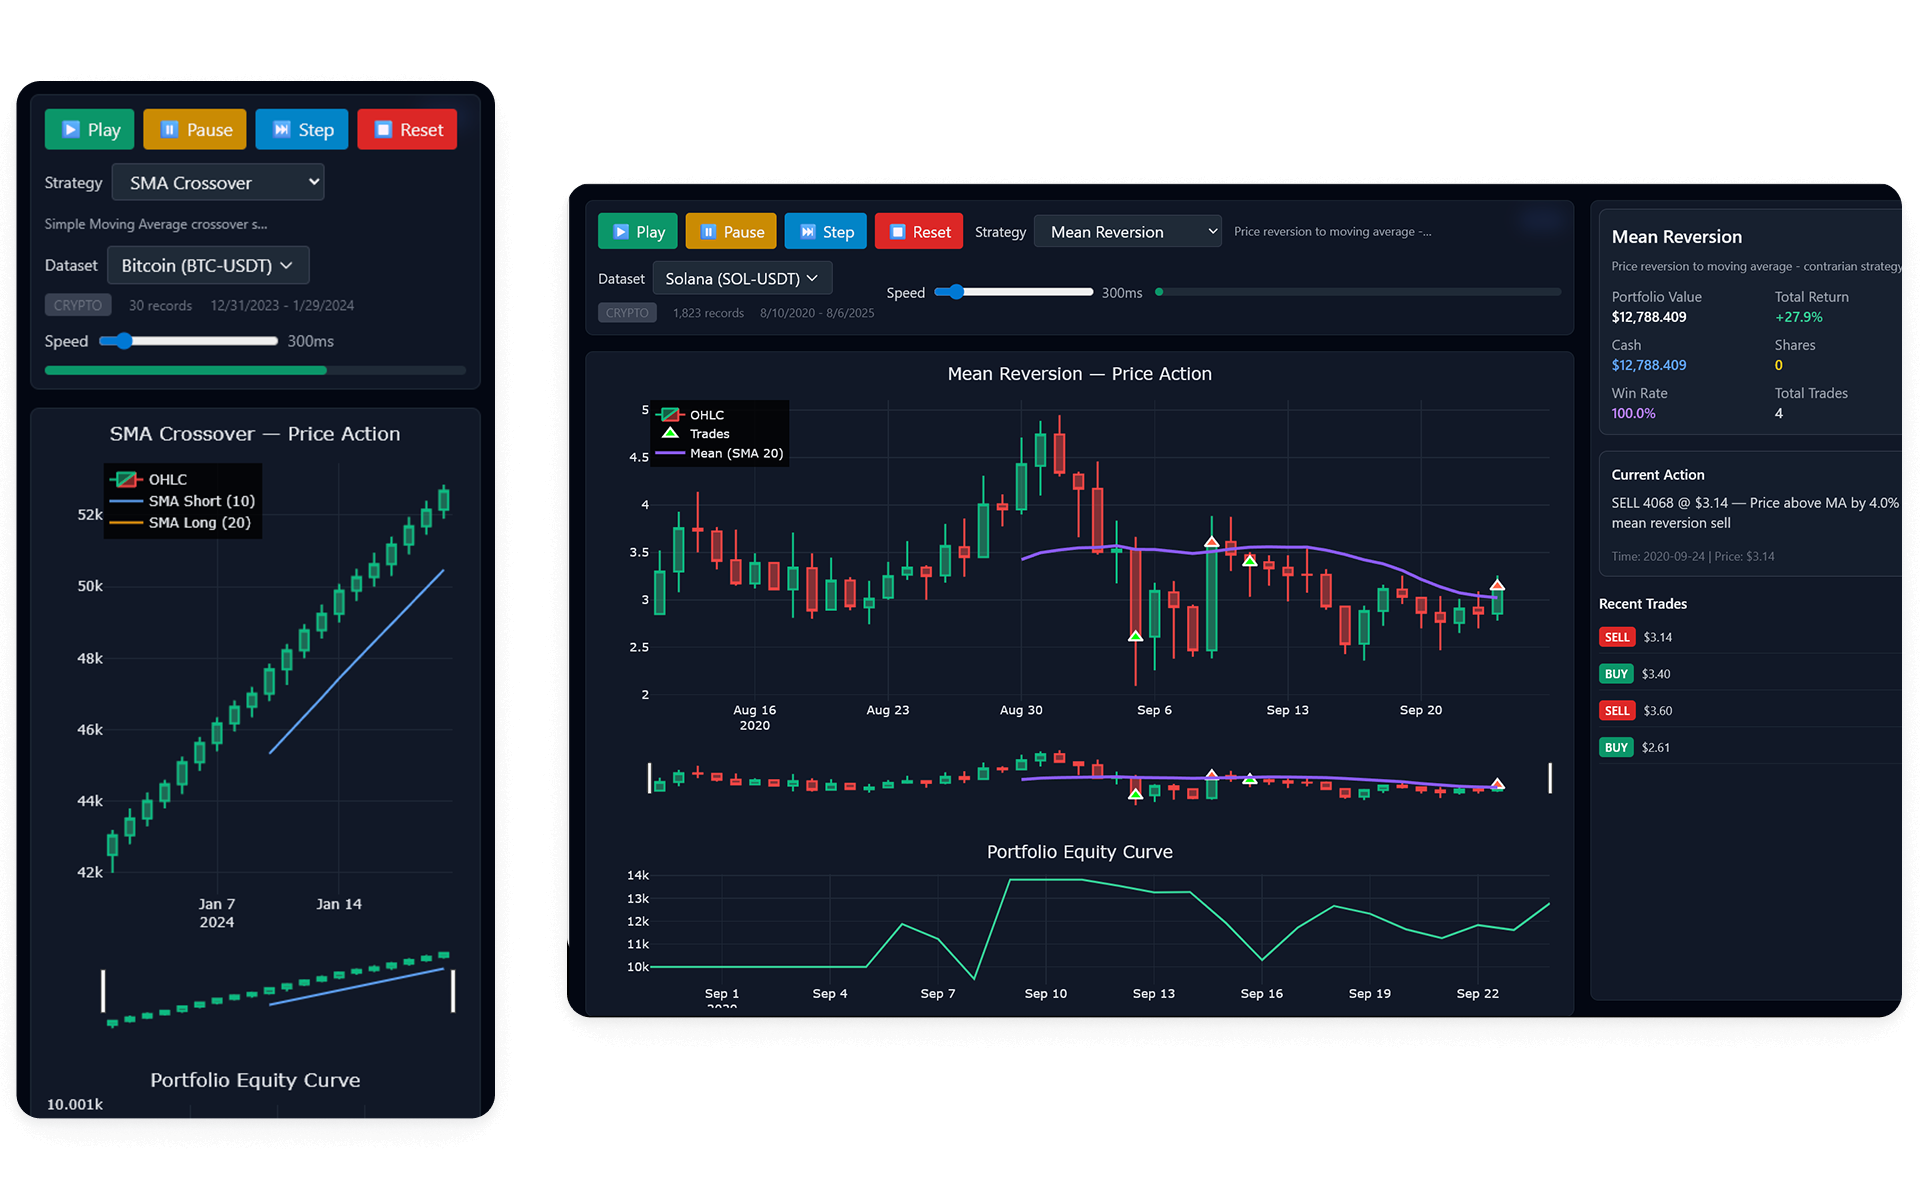
Trading strategies can be complex to understand and validate without proper visualization and backtesting tools. This platform was built to help traders and developers test their algorithmic strategies against real market data, providing comprehensive analytics and visual feedback to optimize trading performance.
Challenge
Developing and testing trading strategies requires access to historical data, backtesting capabilities, and clear visualization of results. Many existing tools are either too complex for beginners or lack the flexibility needed for custom strategy development and analysis.
Action
Real-Time Data Integration
The platform integrates with Yahoo Finance API to fetch real historical market data, ensuring that backtests run against accurate price movements and volume data. This provides realistic testing conditions for strategy validation.
Interactive Strategy Testing
Users can implement and test various trading strategies including moving averages, RSI-based approaches, and custom algorithms. The system processes trades in real-time simulation, tracking entry/exit points and calculating performance metrics.
Comprehensive Visualization
Built with Chart.js and custom React components, the platform provides detailed charts showing price movements, strategy signals, and performance analytics. Interactive elements allow users to zoom into specific time periods and analyze trading decisions.
Technical Implementation
The application uses Next.js for server-side rendering and API routes, enabling efficient data processing and caching. TypeScript ensures type safety across the trading logic, while TailwindCSS provides a responsive and intuitive user interface for strategy configuration and results analysis.
Result
Trading Bot Visualizer successfully democratizes algorithmic trading strategy development by providing an accessible platform for backtesting and visualization. The tool helps users understand strategy performance, optimize parameters, and gain confidence in their trading approaches before deploying with real capital.